Most businesses running Google Ads obsess over bidding strategy, campaign structure, and audience targeting — and completely ignore the single metric that determines whether any of that work is cost effective. Quality Score is a 1–10 rating Google assigns to each keyword in your account, and it directly controls your cost per click, your ad position, and whether your ads show at all. After auditing over 200 Google Ads accounts, the pattern is consistent: low Quality Scores are costing most advertisers 30 to 60% more per click than they should be paying.
What Quality Score Actually Is
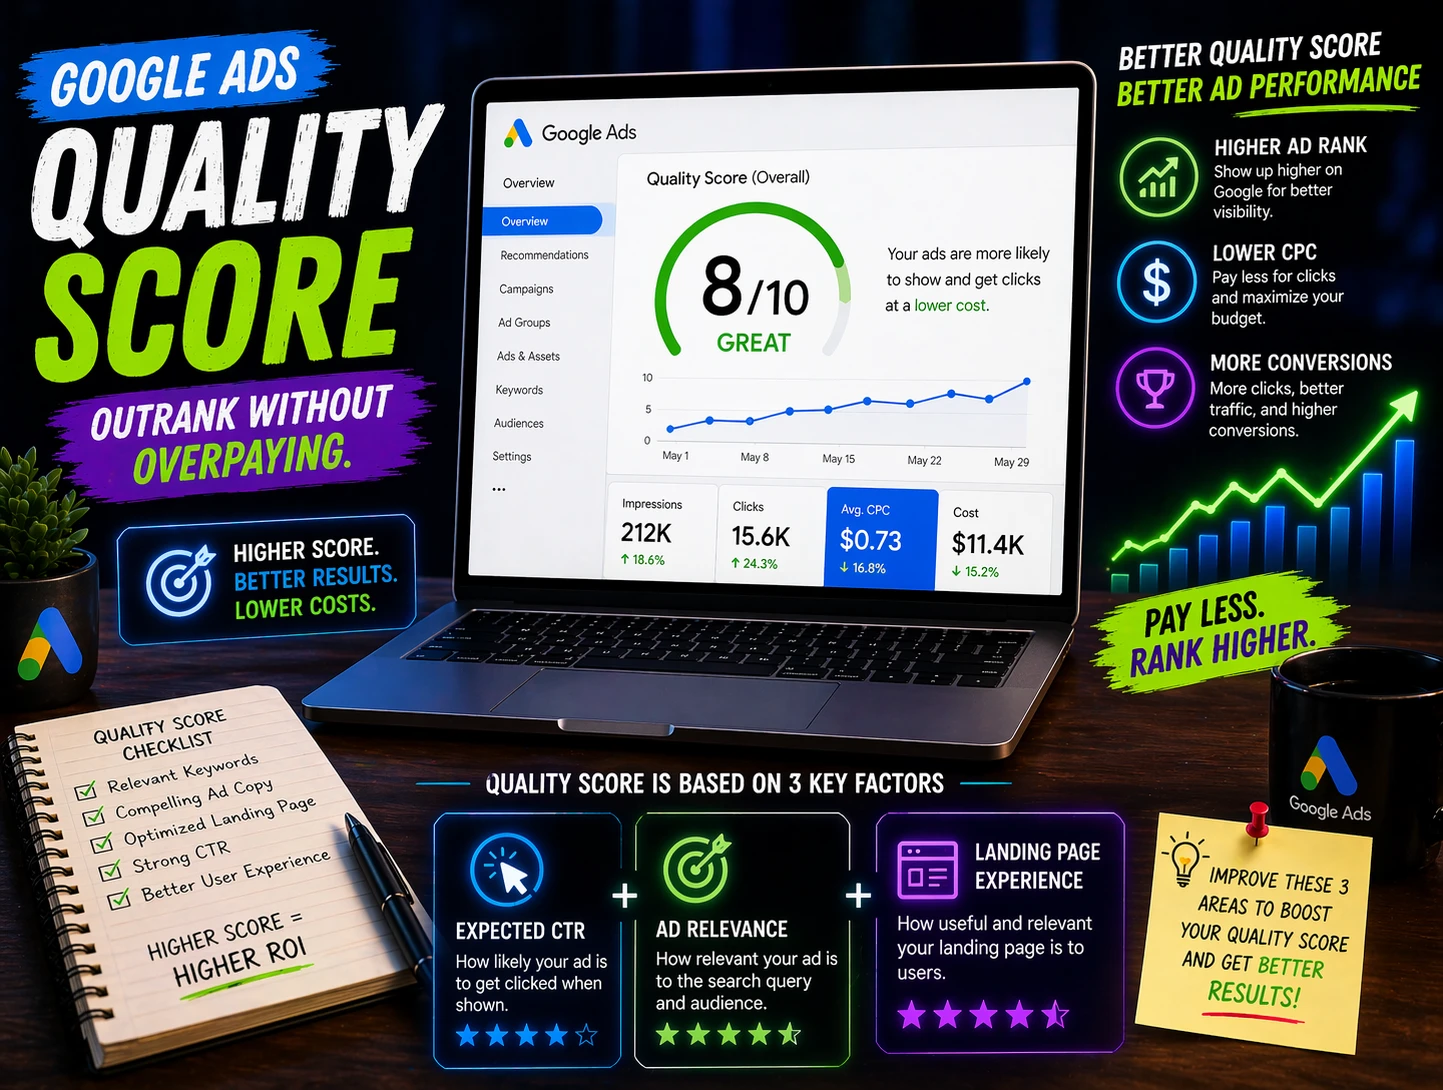
Quality Score is Google's estimate of the quality and relevance of your ads, keywords, and landing pages relative to the user's search query. It's calculated at the keyword level and updated in near real time based on three components: Expected Click Through Rate, Ad Relevance, and Landing Page Experience. Each component is rated Below Average, Average, or Above Average — and the combination of these ratings produces your 1–10 score.
The reason Quality Score matters financially is the Ad Rank formula. Your position in the auction isn't determined by bid alone — it's determined by bid multiplied by Quality Score. A competitor with a QS of 8 bidding $2.00 will beat a competitor with a QS of 4 bidding $3.50 and pay significantly less per click. Google rewards relevance. Advertisers who build for relevance consistently pay less and place higher than those who rely on bidding their way to the top.
Component 1: Expected Click Through Rate
Expected CTR measures how likely your ad is to be clicked when shown for a specific keyword, compared to all other advertisers targeting the same keyword. Google estimates this based on historical CTR data, adjusted for position. The most direct lever for improving Expected CTR is ad copy — specifically, headline relevance and the presence of the search query's intent in the ad.
How to Improve Expected CTR
The highest impact changes we make when auditing accounts with low Expected CTR scores:
- Include the exact keyword or close variant in the first headline — this triggers bold formatting in search results and signals relevance immediately.
- Lead with the value proposition, not the brand name. "Cut Your Energy Bill 40%" outperforms "[Brand Name] Energy Services" in CTR consistently.
- Use numbers and specificity — "23 Years Experience," "Rated 4.9 Stars," "From $99/Month" — outperform vague claims in every vertical we've tested.
- Deploy RSAs (Responsive Search Ads) with 15 unique headlines and 4 descriptions and let Google's machine learning identify the highest CTR combinations.
Component 2: Ad Relevance
Ad Relevance measures how closely your ad copy matches the intent behind the user's search query. The single most common cause of Below Average Ad Relevance scores is over broad ad groups — grouping dozens of loosely related keywords into one ad group and writing generic ads that serve all of them. The solution is tighter ad group architecture.
The most expensive mistake in Google Ads isn't a bad bidding strategy. It's paying full price for clicks that a better Quality Score would have given you at half the cost.
The Single Keyword Ad Group (SKAG) Approach
The most aggressive fix for Ad Relevance issues is moving to Single Keyword Ad Groups — one keyword per ad group, with all three ad headlines containing that keyword or its direct variants. This approach consistently pushes Ad Relevance to Above Average within two to three weeks of implementation. It requires more build time but the CPCs savings are significant, particularly in competitive verticals like legal, finance, healthcare, and home services.
Component 3: Landing Page Experience
Landing Page Experience is the most neglected Quality Score component and the most impactful for conversion rate simultaneously. Google evaluates three things: whether the page content matches the ad's promise (relevance), how fast the page loads (performance), and how easy it is to navigate and convert (usability). A slow, generic landing page that sends paid traffic to the homepage is costing you twice — once in higher CPCs from a poor Quality Score, and once in conversions lost to a poor user experience.
The Landing Page Checklist We Use on Every Audit
- Message match: The headline on the landing page should contain or closely mirror the ad headline and the search query. If someone searched "emergency plumber London," the landing page H1 should say "Emergency Plumber in London" — not "Welcome to [Company] Plumbing Services."
- Page speed: Target under 2.5 seconds load time on mobile. Google's own data shows that conversion rate drops 20% for every additional second of load time past this threshold.
- Single clear CTA: One primary action per landing page. Every additional option reduces conversion rate.
- Trust signals above the fold: Reviews, accreditations, guarantees, and recognisable client logos should be visible without scrolling.
- Mobile first design: Over 60% of paid search clicks on most client accounts come from mobile. If your landing page isn't designed for mobile first interaction, you're losing conversions regardless of Quality Score.
The Account Audit Process: Where to Start
When we inherit a Google Ads account, the Quality Score audit is always the first thing we run. The process takes about 90 minutes and consistently identifies 30 to 50% CPC reduction opportunities. Here's the framework:
- Export all active keywords with their Quality Score, Expected CTR, Ad Relevance, and Landing Page Experience ratings.
- Filter for all keywords with QS below 6 — these are your immediate priority.
- For every Below Average Expected CTR: rewrite ad copy to include the keyword in headline 1 and a specific value proposition in headline 2.
- For every Below Average Ad Relevance: move the keyword to its own ad group with dedicated, keyword specific ad copy.
- For every Below Average Landing Page Experience: identify whether the issue is relevance, speed, or UX, and action the relevant fix from the checklist above.
- Allow two to three weeks for scores to update, then re audit.
Quality Score Is a Symptom, Not the Goal
It's worth being clear: Quality Score is a diagnostic tool, not an objective to chase in isolation. An account with a 10/10 Quality Score that converts at 1% is losing to an account with a 7/10 that converts at 8%. The goal is always qualified conversions at the lowest possible CPA. Quality Score improvements are the mechanism by which you lower CPCs, increase reach at the same budget, and improve the economics of every campaign — but conversion rate and ROAS are always the headline metrics.
The Bottom Line
Quality Score is the most directly actionable lever in Google Ads that most advertisers leave completely untouched. A systematic QS audit across Expected CTR, Ad Relevance, and Landing Page Experience will typically reduce CPC by 25 to 45% within 30 days on any account that hasn't been built with relevance as the primary design principle. That's budget freed up for more volume, better positions, or simply a lower cost base — without changing a single bid.
Overpaying For Google Clicks?
We'll audit your Quality Scores and show you exactly how much you're overpaying — and how to fix it.
Get Your Free PPC Audit →